Highcharts 多個Y軸動態刷新數據的實現代碼
編輯:關於JavaScript
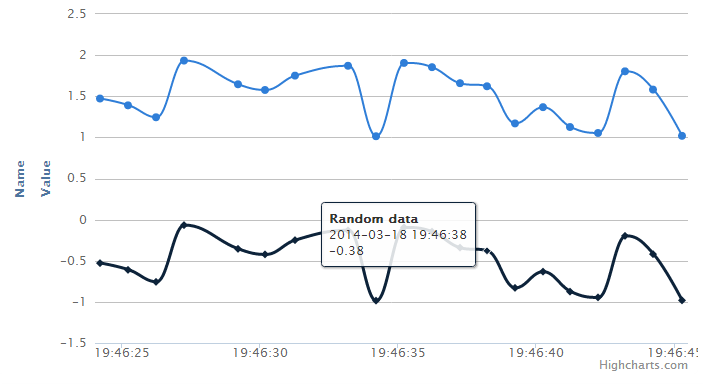
效果圖:
js代碼:
$(function() {
  $(document).ready(function() {
    Highcharts.setOptions({
      global: {
        useUTC: false
      }
    });
    var chart;
    chart = new Highcharts.Chart({
      chart: {
        renderTo: 'container',
        type: 'spline',
        animation: Highcharts.svg,
        // don't animate in old IE
        marginRight: 10,
        events: {
          load: function() {}
        }
      },
      title: {
        text: 'Live random data'
      },
      xAxis: {
        type: 'datetime',
        tickPixelInterval: 150
      },
      yAxis: [{
        title: {
          text: 'Value'
        },
        plotLines: [{
          value: 0,
          width: 1,
          color: '#808080'
        }]
      },
      {
        title: {
          text: 'Name'
        },
        plotLines: [{
          value: 0,
          width: 1,
          color: '#808080'
        }]
      }],
      tooltip: {
        formatter: function() {
          return '<b>' + this.series.name + '</b><br/>' + Highcharts.dateFormat('%Y-%m-%d %H:%M:%S', this.x) + '<br/>' + Highcharts.numberFormat(this.y, 2);
        }
      },
      legend: {
        enabled: false
      },
      exporting: {
        enabled: false
      },
      series: [{
        name: 'Random data',
        data: (function() { // generate an array of random data
          var data = [],
          time = (new Date()).getTime(),
          i;
          for (i = -19; i <= 0; i++) {
            data.push({
              x: time + i * 1000,
              y: Math.random()
            });
          }
          return data;
        })()
      },
      {
        name: 'Random data',
        data: (function() { // generate an array of random data
          var data = [],
          time = (new Date()).getTime(),
          i;
          for (i = -19; i <= 0; i++) {
            data.push({
              x: time + i * 1000,
              y: Math.random()
            });
          }
          return data;
        })()
      }]
    }); // set up the updating of the chart each second
    var series = chart.series[0];
    var series1 = chart.series[1];
    setInterval(function() {
      var x = (new Date()).getTime(),
      // current time
      y = Math.random();
      series.addPoint([x, y + 1], true, true);
      series1.addPoint([x, y - 1], true, true);
    },
    1000);
  });
});
html代碼:
<head>
 <script type="text/javascript" src="js/jquery.min.js"></script>
 <script type="text/javascript" src="js/highcharts.js"></script>
 <script type="text/javascript" src="js/exporting.js"></script>
 <script>
  //左側Javascript代碼
 </script>
</head>
<body>
 <div id="container" style="min-width:700px;height:400px"></div>
</body>
以上這篇Highcharts 多個Y軸動態刷新數據的實現代碼 就是小編分享給大家的全部內容了,希望能給大家一個參考,也希望大家多多支持。
相關文章
- css width height同時設置
- font-weight:bold 設置字體加粗CSS樣式
- margin-right css右外邊距 右外邊間隔
- padding-right css右內邊距樣式
- text-decoration:line-through CSS文字中劃線 刪除線 貫穿線樣式
- JavaScript中removeChild 方法開發示例代碼
- Ajax 設置Access-Control-Allow-Origin實現跨域訪問
- jQuery插件HighCharts實現氣泡圖效果示例【附demo源碼】
- jQuery插件HighCharts實現的2D堆條狀圖效果示例【附demo源碼下載】
- jQuery插件HighCharts繪制的2D堆柱狀圖效果示例【附demo源碼下載】
小編推薦
熱門推薦