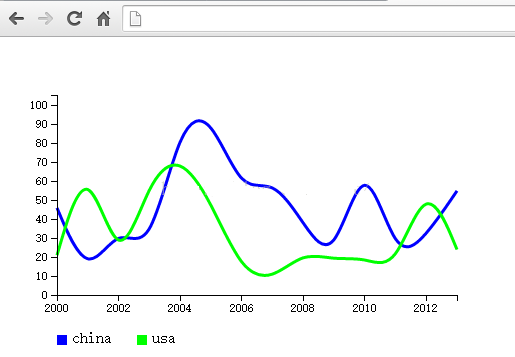
基於d3.js實現實時刷新的折線圖
編輯:關於JavaScript
先來看看效果圖
下面直接上源代碼,html文件
<html>
 <head>
    <meta charset="utf-8">
    <title>實時刷新折線圖</title>
 <style>
 .axis path,
 .axis line{
 fill: none;
 stroke: black;
 shape-rendering: crispEdges;
 }

 .axis text {
 font-family: sans-serif;
 font-size: 11px;
 }

 .overlay {
 fill: none;
 pointer-events: all;
 }

 .tooltip{
 width: 150px;
 height: auto;
 position: absolute;
 font-family: simsun;
 font-size: 16px;
 line-height: 26px;
 text-align: left;
 border: 1px solid black;
 background-color: white;
 border-radius: 5px;
  }

  .tooltip .title{
   border-bottom: 1px solid #000;
   text-align: center;
  }

  .tooltip .desColor{
   width: 10px;
   height: 10px;
   float: left;
 margin: 9px 8px 1px 8px;
  }

  .tooltip .desText{
   display: inline;
  }

  .focusLine {
 stroke: black;
 stroke-width: 1px;
 stroke-dasharray: 5,5;
 }
 </style>
 </head>
<body>

<script src="http://d3js.org/d3.v3.js" charset="utf-8"></script>
<script src="linechart.js" charset="utf-8"></script>
<svg contentScriptType="text/ecmascript" width="2000" xmlns:xlink="http://www.w3.org/1999/xlink" zoomAndPan="magnify" style="background-color:#ffffff;" contentStyleType="text/css" viewBox="0 0 2000.0 2000.0" height="2000" preserveAspectRatio="xMidYMid meet" xmlns="http://www.w3.org/2000/svg" version="1.0">
<defs>
<symbol id="fillgauge1" viewBox="0 0 500.0 300.0" preserveAspectRatio="none meet">
</symbol>
<symbol id="fillgauge2" viewBox="0 0 200.0 200.0" preserveAspectRatio="none meet">
</symbol>
</defs>
<use x="0" y="0" width="500" xmlns:xlink="http://www.w3.org/1999/xlink" xlink:href="#fillgauge1" xlink:type="simple" xlink:actuate="onLoad" symboltype="17" height="300" xlink:show="embed"/>
<use x="20" y="20" width="50" xmlns:xlink="http://www.w3.org/1999/xlink" xlink:href="#fillgauge2" xlink:type="simple" xlink:actuate="onLoad" symboltype="17" height="180" xlink:show="embed"/>
</svg>
<script>
var dataset = [
 {
 country: "china",
 gdp: [[2000,11920],[2001,13170],[2002,14550],
  [2003,16500],[2004,19440],[2005,22870],
  [2006,27930],[2007,35040],[2008,45470],
  [2009,51050],[2010,59490],[2011,73140],
  [2012,83860],[2013,103550]]
 },
 {
 country: "usa",
 gdp: [[2000,47310],[2001,41590],[2002,39800],
  [2003,43020],[2004,46550],[2005,45710],
  [2006,43560],[2007,43560],[2008,48490],
  [2009,50350],[2010,54950],[2011,59050],
  [2012,59370],[2013,48980]]
 }
];

var gauge1=loadLineChart("fillgauge1",dataset);
 function NewValue(){
    if(Math.random() > .5){
      return Math.round(Math.random()*100);
    } else {
      return (Math.random()*100).toFixed(1);
    }
  }

function refreshLine(gauge1){
 //alert("hehe");
 // document.getElementById("fillgauge1").innerHTML="";
 var updateData =[
 {
 country: "china",
 gdp: [[2000,NewValue()],[2001,NewValue()],[2002,NewValue()],
  [2003,NewValue()],[2004,NewValue()],[2005,NewValue()],
  [2006,NewValue()],[2007,NewValue()],[2008,NewValue()],
  [2009,NewValue()],[2010,NewValue()],[2011,NewValue()],
  [2012,NewValue()],[2013,NewValue()]]
 },
 {
 country: "usa",
 gdp: [[2000,NewValue()],[2001,NewValue()],[2002,NewValue()],
  [2003,NewValue()],[2004,NewValue()],[2005,NewValue()],
  [2006,NewValue()],[2007,NewValue()],[2008,NewValue()],
  [2009,NewValue()],[2010,NewValue()],[2011,NewValue()],
  [2012,NewValue()],[2013,NewValue()]]
 }
  ];

 gauge1.update(updateData);
 }
self.setInterval("refreshLine(gauge1)",5000);
</script>

</body>
</html>
lineChart.js負責加載和刷新折線圖
function loadLineChart(elementId, dataset) {
 var svg = d3.select("#" + elementId);
 var strs = svg.attr("viewBox").split(" ");
 alert(dataset);
 var width = strs[2];
 var height = strs[3];

 //外邊框
 var padding = {
 top : 50,
 right : 50,
 bottom : 50,
 left : 50
 };

 var names = new Array();
 //計算GDP的最大值
 var gdpmax = 0;
 for (var i = 0; i < dataset.length; i++) {
 var currGdp = d3.max(dataset[i].gdp, function (d) {
  return d[1];
  });
 if (currGdp > gdpmax)
  gdpmax = currGdp;

 }
 var gdpnumb = dataset[0].gdp.length;
 for (var j = 0; j < gdpnumb; j++) {
 names[j] = (dataset[0].gdp[j])[0];
 }

 alert(names);
 var xScale = d3.scale.linear()
 .domain([2000, 2013])
 .range([0, width - padding.left - padding.right]);
 // var xScale = d3.scale.ordinal()
 // .domain(names)
 // .rangeRoundBands([0, width - padding.left - padding.right]);

 var yScale = d3.scale.linear()
 .domain([0, gdpmax * 1.1])
 .range([height - padding.top - padding.bottom, 0]);

 //創建一個直線生成器
 var linePath = d3.svg.line()
 .x(function (d) {
  return xScale(d[0]);
 })
 .y(function (d) {
  return yScale(d[1]);
 })
 .interpolate("basis");

 //定義兩個顏色
 var colors = [d3.rgb(0, 0, 255), d3.rgb(0, 255, 0)];

 //添加路徑
 svg.selectAll("path") //選擇<svg>中所有的<path>
 .data(dataset) //綁定數據
 .enter() //選擇enter部分
 .append("path") //添加足夠數量的<path>元素
 .attr("transform", "translate(" + padding.left + "," + padding.top + ")")
 .attr("d", function (d) {
 return linePath(d.gdp); //返回直線生成器得到的路徑
 })
 .attr("fill", "none")
 .attr("stroke-width", 3)
 .attr("stroke", function (d, i) {
 return colors[i];
 });

 //添加垂直於x軸的對齊線
 var vLine = svg.append("line")
 .attr("class", "focusLine")
 .style("display", "none");

 //添加一個提示框
 var tooltip = d3.select("body")
 .append("div")
 .attr("class", "tooltip")
 .style("opacity", 0.0);

 var title = tooltip.append("div")
 .attr("class", "title");

 var des = tooltip.selectAll(".des")
 .data(dataset)
 .enter()
 .append("div");

 var desColor = des.append("div")
 .attr("class", "desColor");

 var desText = des.append("div")
 .attr("class", "desText");

 //添加一個透明的監視鼠標事件用的矩形
 svg.append("rect")
 .attr("class", "overlay")
 .attr("x", padding.left)
 .attr("y", padding.top)
 .attr("width", width - padding.left - padding.right)
 .attr("height", height - padding.top - padding.bottom)
 .on("mouseover", function () {
 tooltip.style("left", (d3.event.pageX) + "px")
 .style("top", (d3.event.pageY + 20) + "px")
 .style("opacity", 1.0);

 vLine.style("display", null);
 })
 .on("mouseout", function () {
 tooltip.style("opacity", 0.0);
 vLine.style("display", "none");
 })
 .on("mousemove", mousemove);

 function mousemove() {
 /* 當鼠標在透明矩形內滑動時調用 */

 //折線的源數組
 var data = dataset[0].gdp;

 //獲取鼠標相對於透明矩形左上角的坐標,左上角坐標為(0,0)
 var mouseX = d3.mouse(this)[0] - padding.left;
 var mouseY = d3.mouse(this)[1] - padding.top;

 //通過比例尺的反函數計算原數據中的值,例如x0為某個年份,y0為GDP值
 var x0 = xScale.invert(mouseX);
 var y0 = yScale.invert(mouseY);

 //對x0四捨五入,如果x0是2005.6,則返回2006;如果是2005.2,則返回2005
 x0 = Math.round(x0);

 //查找在原數組中x0的值,並返回索引號
 var bisect = d3.bisector(function (d) {
  return d[0];
  }).left;
 var index = bisect(data, x0);

 //獲取年份和gdp數據
 var year = x0;
 var gdp = [];

 for (var k = 0; k < dataset.length; k++) {
  gdp[k] = {
  country : dataset[k].country,
  value : dataset[k].gdp[index][1]
  };
 }

 //設置提示框的標題文字(年份)
 title.html("<strong>" + year + "年</strong>");

 //設置顏色標記的顏色
 desColor.style("background-color", function (d, i) {
  return colors[i];
 });

 //設置描述文字的內容
 desText.html(function (d, i) {
  return gdp[i].country + "\t" + "<strong>" + gdp[i].value + "</strong>";
 });

 //設置提示框的位置
 tooltip.style("left", (d3.event.pageX) + "px")
 .style("top", (d3.event.pageY + 20) + "px");

 //獲取垂直對齊線的x坐標
 var vlx = xScale(data[index][0]) + padding.left;

 //設定垂直對齊線的起點和終點
 vLine.attr("x1", vlx)
 .attr("y1", padding.top)
 .attr("x2", vlx)
 .attr("y2", height - padding.bottom);
 }

 var markStep = 80;

 var gMark = svg.selectAll(".gMark")
 .data(dataset)
 .enter()
 .append("g")
 .attr("transform", function (d, i) {
  return "translate(" + (padding.left + i * markStep) + "," + (height - padding.bottom + 40) + ")";
 });

 gMark.append("rect")
 .attr("x", 0)
 .attr("y", 0)
 .attr("width", 10)
 .attr("height", 10)
 .attr("fill", function (d, i) {
 return colors[i];
 });

 gMark.append("text")
 .attr("dx", 15)
 .attr("dy", ".5em")
 .attr("fill", "black")
 .text(function (d) {
 return d.country;
 });

 //x軸
 var xAxis = d3.svg.axis()
 .scale(xScale)
 .ticks(5)
 .tickFormat(d3.format("d"))
 .orient("bottom");

 //y軸
 var yAxis = d3.svg.axis()
 .scale(yScale)
 .orient("left");

 svg.append("g")
 .attr("class", "axis")
 .attr("transform", "translate(" + padding.left + "," + (height - padding.bottom) + ")")
 .call(xAxis);

 svg.append("g")
 .attr("class", "y axis")
 .attr("transform", "translate(" + padding.left + "," + padding.top + ")")
 .call(yAxis);

 function updateLineChart() {

 this.update = function (updateData) {
  //xScale.domain(updateData,function(d){return d.name});
  var numValues = updateData.length;
  var updategdpmax = 0;
  for (var i = 0; i < updateData.length; i++) {
  var currGdp = d3.max(updateData[i].gdp, function (d) {
   return d[1];
   });
  if (currGdp > updategdpmax)
   updategdpmax = currGdp;
  }

  yScale = d3.scale.linear()
  .domain([0, updategdpmax * 1.1])
  .range([height - padding.top - padding.bottom, 0]);
  yAxis = d3.svg.axis()
  .scale(yScale)
  .orient("left");
  svg.selectAll("g.y.axis")
  .call(yAxis);

  svg.selectAll("path") //選擇<svg>中所有的<path>
  .data(updateData) //綁定數據
  .transition()
  .duration(2000)
  .ease("linear")
  .attr("d", function (d) {

  return linePath(d.gdp); //返回直線生成器得到的路徑
  });

 }

 }
 return new updateLineChart();
}
剛開始數據刷新了但是坐標軸木有刷新
引入
svg.selectAll("g.y.axis")
  .call(yAxis);
以上就是d3.js實現實時刷新折線圖的全部內容,希望給大家學習d3.js帶來幫助。
小編推薦
熱門推薦